
Power grids and local constraints
Large data centers depend on electricity connections, transformers, transmission and cooling. Interconnection bottlenecks may constrain buildout, while local impacts differ across regions and tariffs.
AI systems require electricity in data centers for computation, networking and cooling. Total data-center electricity demand is not the same as AI-only consumption; future demand depends on uncertain adoption and efficiency assumptions. Cortist separates measured use, forecasts and grid promises.
No. Data centers also support cloud computing, storage and other services. Estimates for all data centers should not be relabeled as AI-only electricity use.
Review the data-center forecast →Measured utility dispatch records, duration and grid outcomes provide stronger evidence than an announced flexible-demand agreement.
Examine the 1,000 MW agreement →Guide clarified 3 November 2026 · Source findings and forecast assumptions below retain their original recorded dates · Editorial standards
Data centers consume electricity for servers, networking and cooling; AI is an important driver but not the sole use. The IEA estimated approximately 415 TWh of global data-center electricity consumption in 2024 and modeled around 945 TWh by 2030 in its Base Case. The second number is a projection, not a measured fact. Cortist’s E-001 remains on HOLD.
Evidence Pulse 2.0 checks the published Cortist News index when JavaScript is available. The source-linked, dated research articles remain accessible through Cortist News.
Latest topic-linked reporting, compared with the separately versioned Cortist assessment. News does not automatically update a forecast.
Evidence interpretation: On-site energy and grid-policy reports document pressures on data-center infrastructure.
What remains unproven: Infrastructure plans do not resolve future national AI electricity consumption.
What to verify next: Data-center electricity measurements, grid connection timelines and rebound effects.
Snapshot of 2 linked reports. Context is not independent proof or a measured probability change. Dated evidence index.
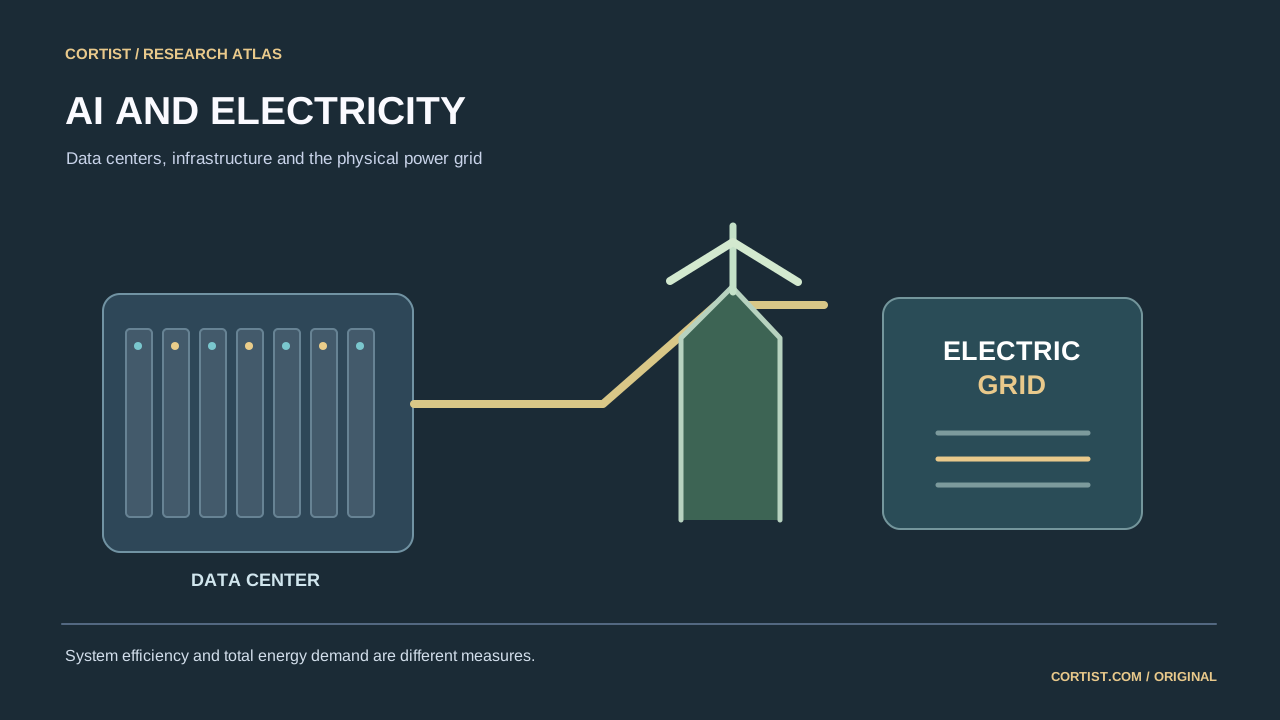
A meaningful energy claim identifies whether it covers AI training, inference, all data-center IT equipment, facility cooling, building operations or electricity-system impacts. These are not interchangeable. The IEA’s 2025 Energy and AI analysis estimated total global data-center demand, not electricity consumed by AI models alone. Estimates depend on installed servers, utilization, power efficiency, facility type and data availability.
The world can experience a relatively modest data-center share of total electricity while particular substations, cities or regions face considerable pressures. Grid connection queues, transmission constraints, backup generation and local supply adequacy often matter more for planning than a single global percentage.
The IEA estimated approximately 415 terawatt-hours for data centers worldwide in 2024, equivalent to about 1.5% of global electricity use. Its Base Case around 945 TWh in 2030 is a modeled outlook shaped by assumptions about hardware shipments, AI adoption, efficiency and other constraints. It should never be charted as a 2030 measurement.
The IEA also describes alternative sensitivity scenarios, including higher efficiency and demand-limiting headwinds. Different assumptions produce different outcomes. For corporate or government forecasts, always ask whether the figure refers to annual energy (TWh), instantaneous power (GW), nameplate capacity or a local grid connection request.
Better chips, software optimization and more efficient cooling can reduce energy per computation. At the same time, lower unit costs can encourage more AI use and larger installations. Aggregate electricity demand may rise even when individual queries become more efficient. Cooling choices can also change local water demand; water and carbon claims must specify geography, cooling technology, power mix and accounting period.
Electricity sourcing also matters. Contracting renewable energy does not automatically establish that every hour of data-center load is carbon free or that a constrained regional grid can deliver the contracted supply. Compare actual metered consumption, local grid investments and credible operational data instead of relying solely on announcements.
E-001 asks whether data centers will account for at least 12% of US electricity use in 2030. It is on HOLD; the historical 54% candidate estimate is not a locked or scored forecast. A global IEA data-center estimate cannot resolve this US-specific future threshold. Final resolution would need a stable national data definition, consistent denominator and credible year-end statistics.
CL-0009 tracks an IEA inventory of grid-related policy measures. Counting 134 rules is not the same as measuring their effectiveness, new grid capacity or faster connections. Updates should prioritize observed grid outcomes, transparent data revisions and verifiable energy accounting rather than simply increasing the number of announcements.
Electricity consumption is energy over time, commonly measured in TWh per year. Power demand and grid connection capacity are usually reported in MW or GW. A proposal for a gigawatt-scale connection does not establish a year of actual consumption.
Accounting also has boundaries: AI training, inference, all servers, data-center cooling and associated infrastructure differ. The IEA’s 2025 analysis estimates the entire global data-center sector, not AI-only model usage.
The IEA estimated about 415 TWh in 2024, around 1.5% of world electricity consumption. Its 2030 Base Case projects roughly 945 TWh, just under 3% of global demand. The first is a historic estimate and the second is a modeled outlook dependent on assumptions about servers, electricity supply, efficiency and usage.
Alternative IEA sensitivity cases reflect uncertainty in future adoption and infrastructure. Publishing only the largest number without its scenario or year misrepresents the evidence. The existing Cortist chart labels estimate and scenario separately.
A small global electricity share can coincide with major strain in a region where facilities cluster. Utilities may face expensive substations, transmission upgrades or lengthy connection queues. The timeline for building electricity infrastructure can differ from the timeline for deploying new servers.
Planned capacity, approved capacity, construction progress and metered facility use are different stages of evidence. A signed corporate supply announcement does not automatically mean hourly electricity is available at the required site.
Hardware, cooling and software may reduce energy per computational task. Yet lower cost can encourage more workloads, new products and larger installations. Aggregate demand can therefore rise alongside efficiency improvements.
Simple “electricity per prompt” figures are difficult to compare because they depend on model, batch size, hardware, facility, accounting boundary and location. Favor transparent method and time period over viral estimates without provenance.
E-001 asks whether data centers will represent at least 12% of US electricity use in calendar year 2030. A world-wide IEA scenario cannot settle a US-specific future share. The question needs a stable definition of US data-center demand and the same period for the total US denominator.
The 54% candidate value remains on HOLD, not an active scored forecast. CL-0009 tracks an IEA inventory of grid-related policies; counting rules is not proof that they work. Relevant Ledger evidence must distinguish announcements from implemented changes.
The IEA Energy and AI assessment distinguishes observed-period estimates from future scenarios. Its global 2024 data-center estimate of 415 TWh and 2030 Base Case of around 945 TWh cover all data centers, not only AI workloads. A modeled Base Case is not an observed 2030 outcome.
Local grid bottlenecks can matter even when the global share is modest. The US-specific E-001 12% electricity-share candidate cannot be settled using a global forecast, and its historic 54% candidate remains on HOLD. Ledger records of policy measures should not be confused with evidence that those policies increased delivered capacity.
Research results, company claims and provisional Cortist forecasts remain distinct.
Scientific or technical milestones do not automatically prove economic or social outcomes.
Large data centers depend on electricity connections, transformers, transmission and cooling. Interconnection bottlenecks may constrain buildout, while local impacts differ across regions and tariffs.
More efficient models can use less power per operation. Overall demand may still rise as deployment scales, workloads become larger and inference is embedded in new products.
Cortist's 12% threshold measures total US data-center electricity, not AI alone. Observed 2030 use and a comparable national electricity denominator will be needed to judge it.
Our topic pages distinguish observed facts, model scenarios and unresolved future events.
Future probability changes require a new dated version and an evidence-based explanation; old records remain available.
Research question only; no numerical forecast version has been published.
Expert opinions alone do not automatically change a Cortist forecast.Separate the broader topic from a specific dated and independently reviewable event.
The 54% working scenario imposes an assumed distribution on non-probabilistic LBNL scenarios. It is not independently calibrated or locked.
Open the detailed forecast ↗Relevant original Cortist reporting is shown separately from external research announcements and company claims.
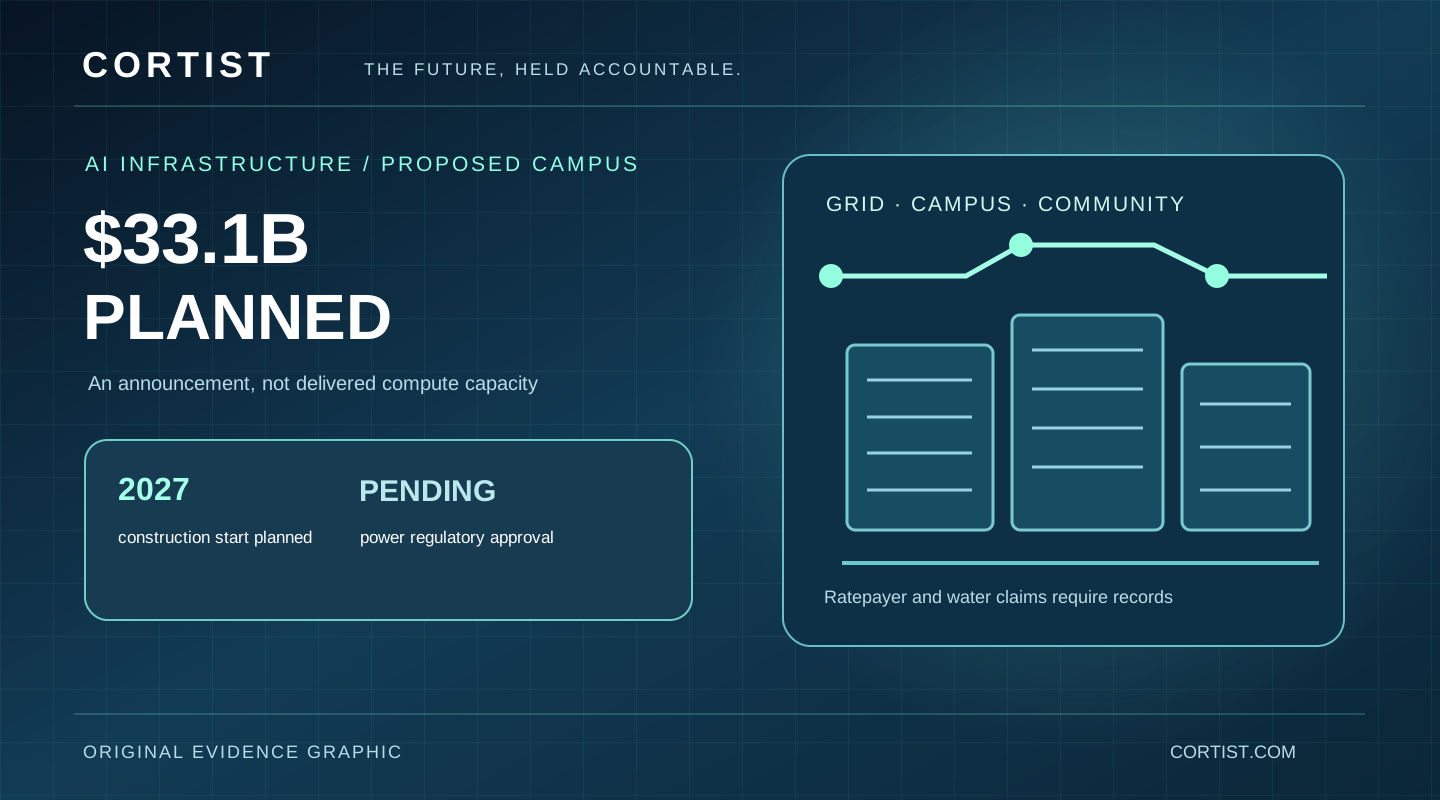
Lambda plans a $33.1B Alabama AI campus, with power approval pending and tax, jobs and water claims still forecasts. We separate announced commitments from delivered outcomes.
Read the evidence review ↗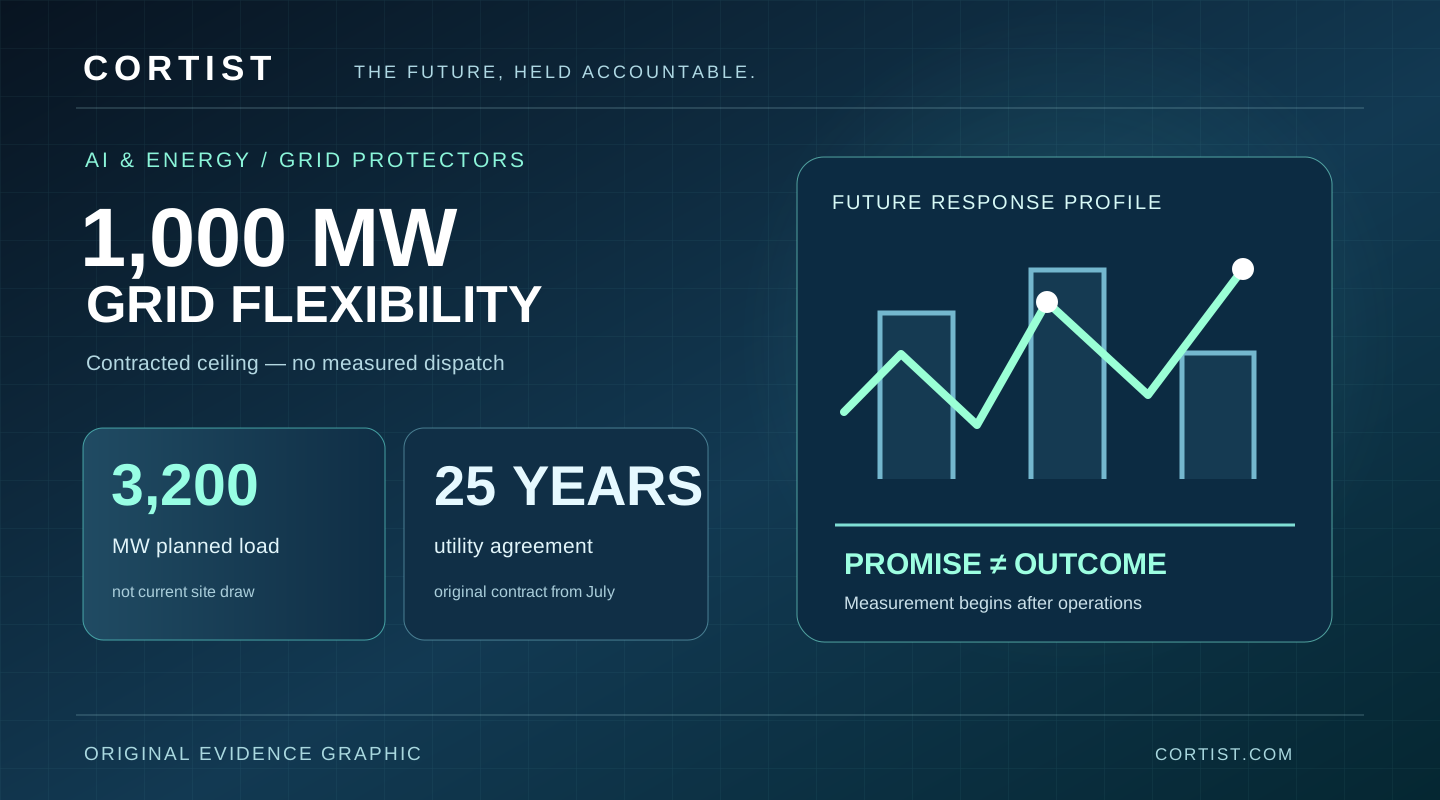
OpenAI’s Grid Protectors program cites a 1,000 MW Georgia demand-response agreement. The capacity is contracted, not a measured delivery result.
Read the source-attributed analysis ↗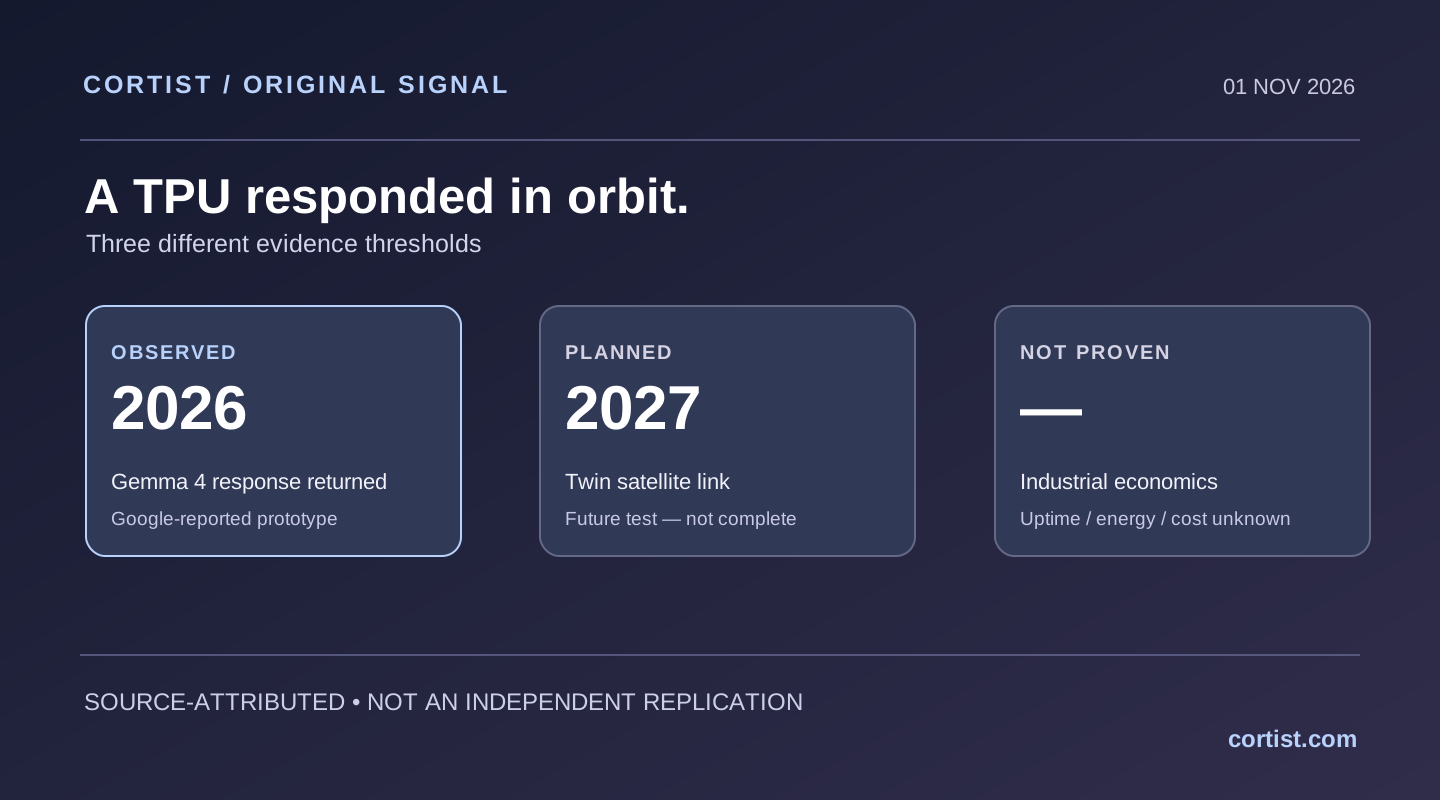
Google reports its first AI response from a data-center-class TPU in orbit. Cortist separates the Project Suncatcher prototype milestone from viable space-based AI infrastructure.
Read the source-attributed analysis ↗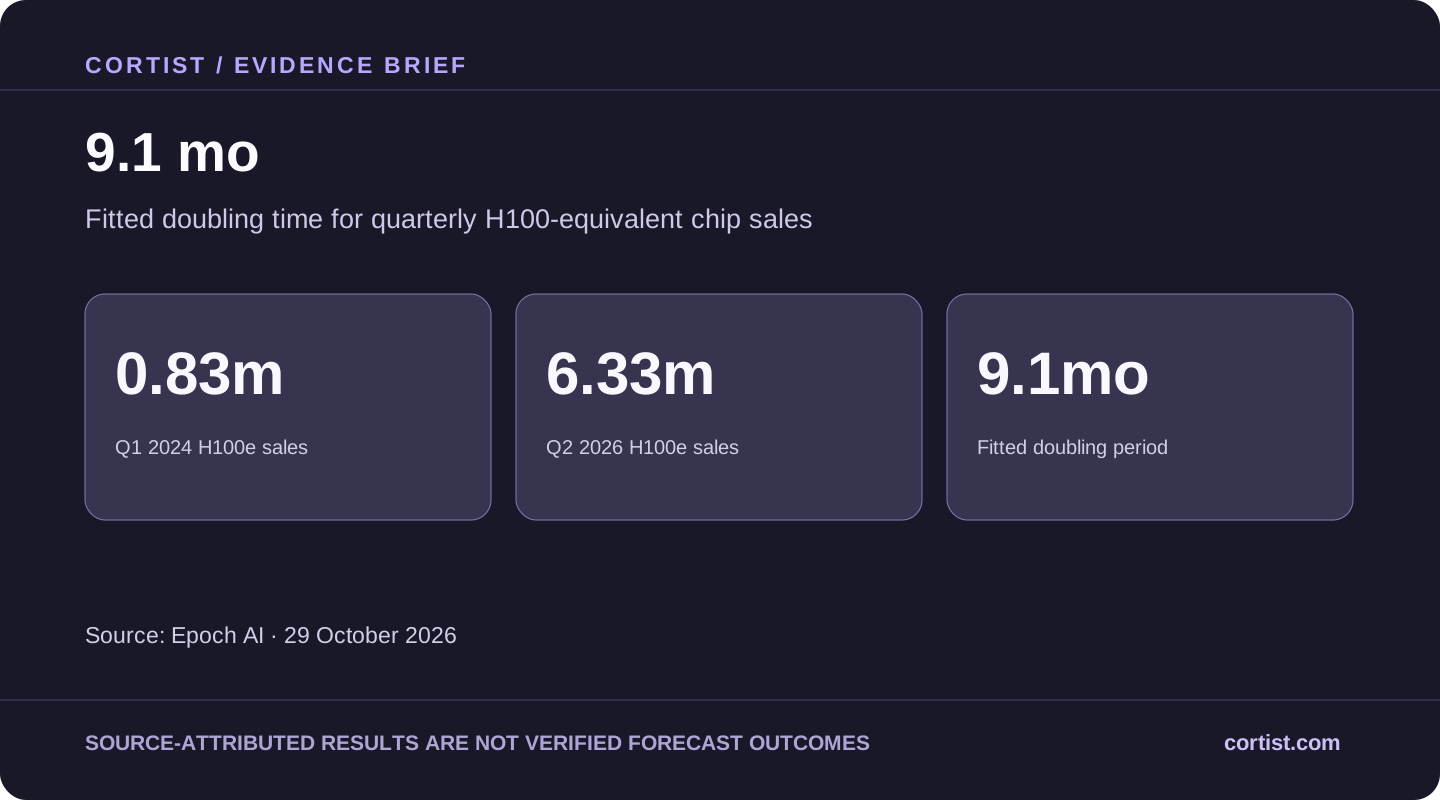
Epoch AI estimates 2.5× yearly growth in compute capacity sold between early 2024 and mid-2026. These are chip-sales estimates, not proof of deployed capacity or AI progress.
Read the source-attributed analysis ↗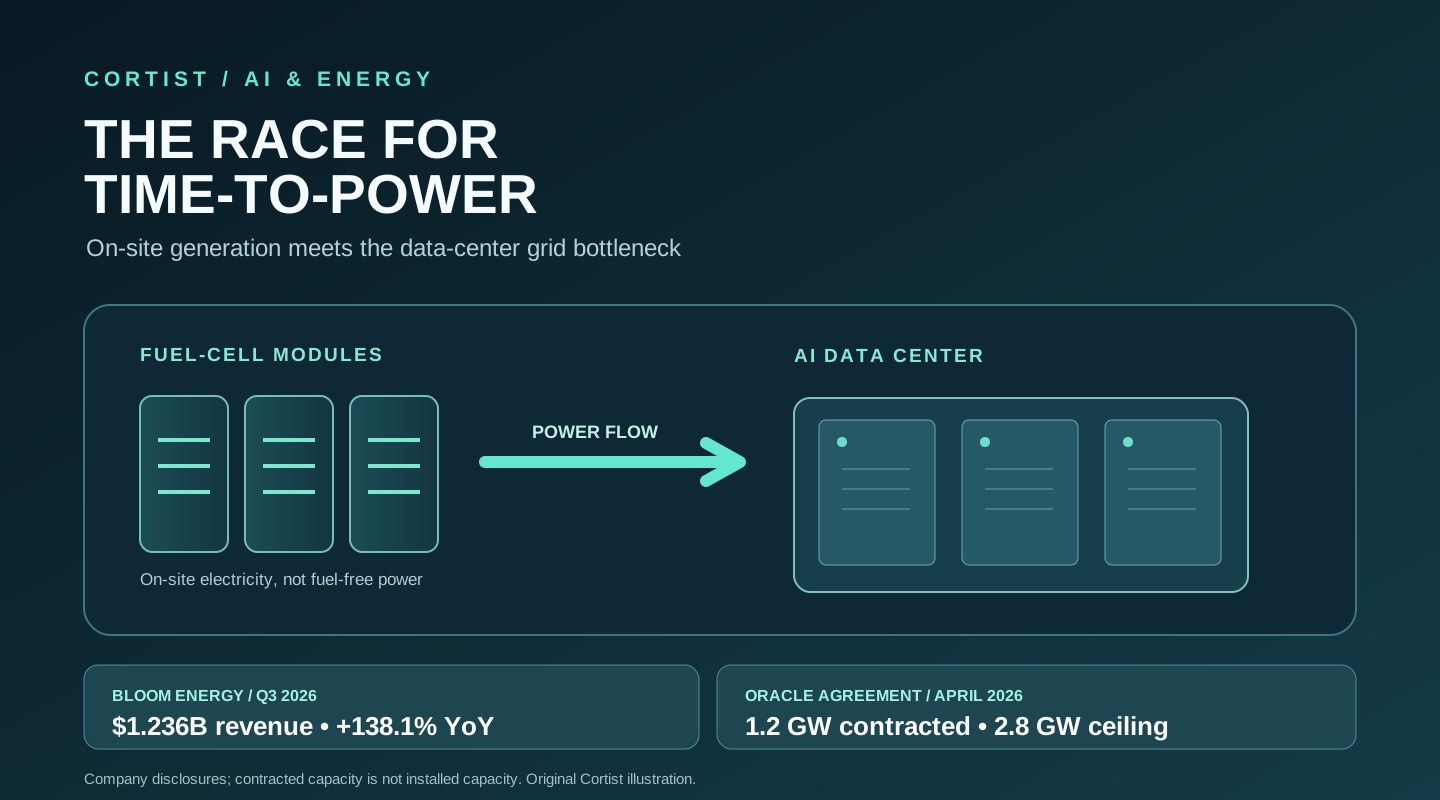
Q3 revenue growth is real; future fuel-cell market estimates and gigawatt-scale contracts still need careful interpretation.
Read full news report ↗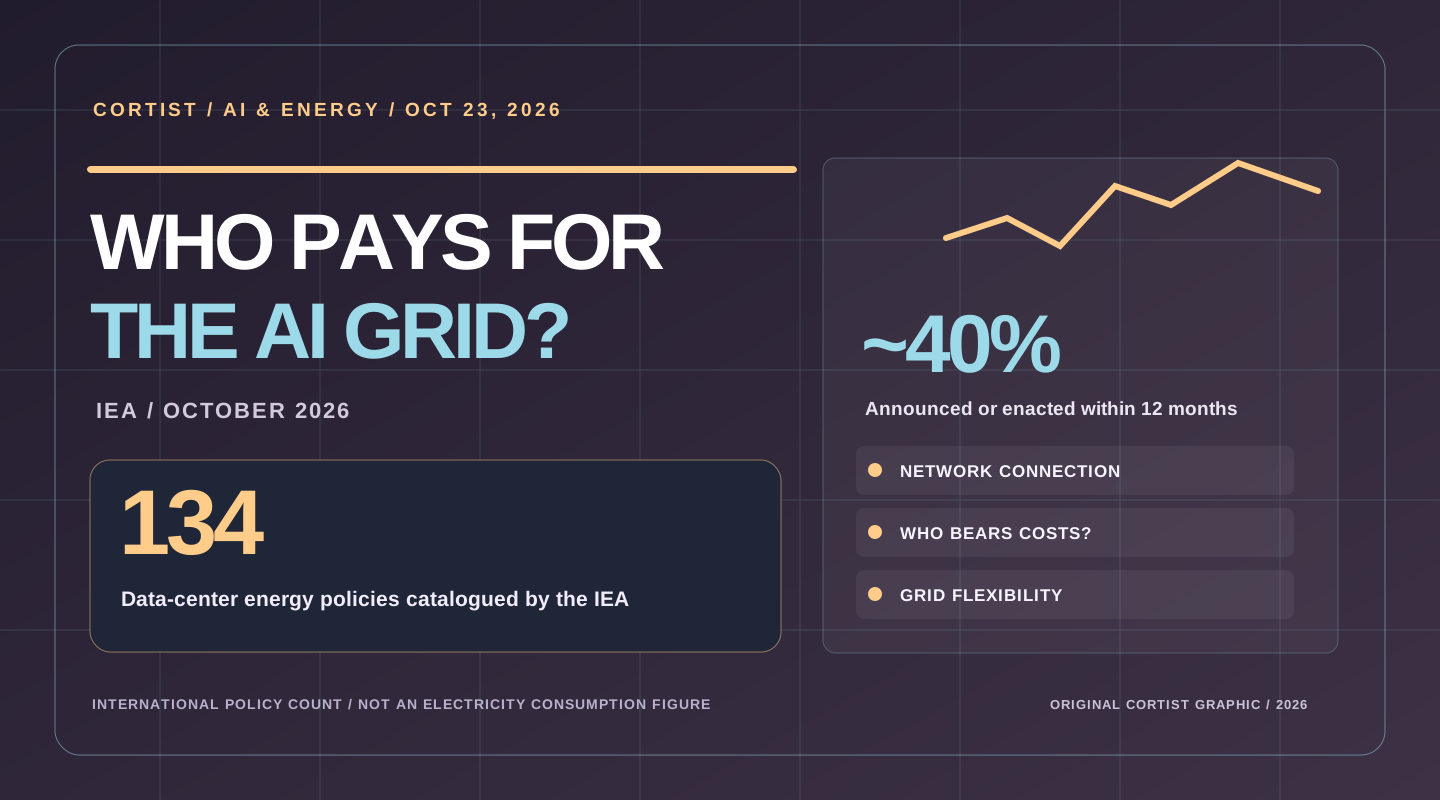
Almost 40% of 134 grid measures were introduced within a year. Who pays for power connections that are never used?
Read full news report ↗External primary-source update, not a Cortist news article or an independently verified forecast outcome.
Read original source ↗External primary-source update, not a Cortist news article or an independently verified forecast outcome.
Read original source ↗Current published news can be explored in the Cortist News archive. Editorial topic associations are documented in our topic-source record.
Original papers, regulatory records or laboratory reports. We distinguish sources from our own forecasts.
LBNL's June 2026 reference scenario estimates 11.8%, alongside scenarios from 9.5% to 15.3%. These are forecasts rather than observed 2030 values.
No. The proposed Cortist milestone concerns all US data centers, including conventional computing and cloud services.
Effects depend on grid geography, regulation, power contracts and infrastructure investments. A national demand scenario cannot establish a specific household price effect.
Potentially, but reduced electricity per task can coincide with much greater total use. The outcome depends on demand growth, data-center design, cooling and energy sources.
Observed, independently checked 2030 data-center electricity as a percentage of US total electricity under consistent definitions; not a present-day projection.
Bloom Energy’s October 22 Q3 report shows company-wide revenue growth. An older Oracle framework and Rystad projections provide context, not evidence of delivered 2030 electricity or a resolved forecast.
Read the full Cortist analysis ↗ · 2030 electricity research question